This week that we're starting to learn what digital media is this week. The teacher introduced AI technology to us by using his own photos as examples. As a new media major student, I am full of interest in these and want to know more about them. I began to look forward to the content of the workshop.
I am a student studying in Leeds. I am very happy to share some study experiences in this blog. You can see many interesting things in this page about sharing the class called Digital Media. I will very happy if my experiences can help you!
Today, we learned how to create and host a website. The tutor gave some examples to help me to understand how to create a website. I think this is an interesting thing, because I never contact with this kind of area.
In the class, I learned that most elements require a closing tag, the same as C language which I learned before. P is used to hold one or more sentences. If you want to put the image on the website, you need to put the URL after "img src=". And we can also help to shape the size of the image, such as width="number" and height="number".
Today, we leant how to web scraping. There are many advantages about learning to scrap messages, such as text, image, video and so on.
Here is a Python Content that we can count the page data.
In class, I discussed with the teacher the use of this piece of Python, such as how to express the writecount in the text separately as the title.
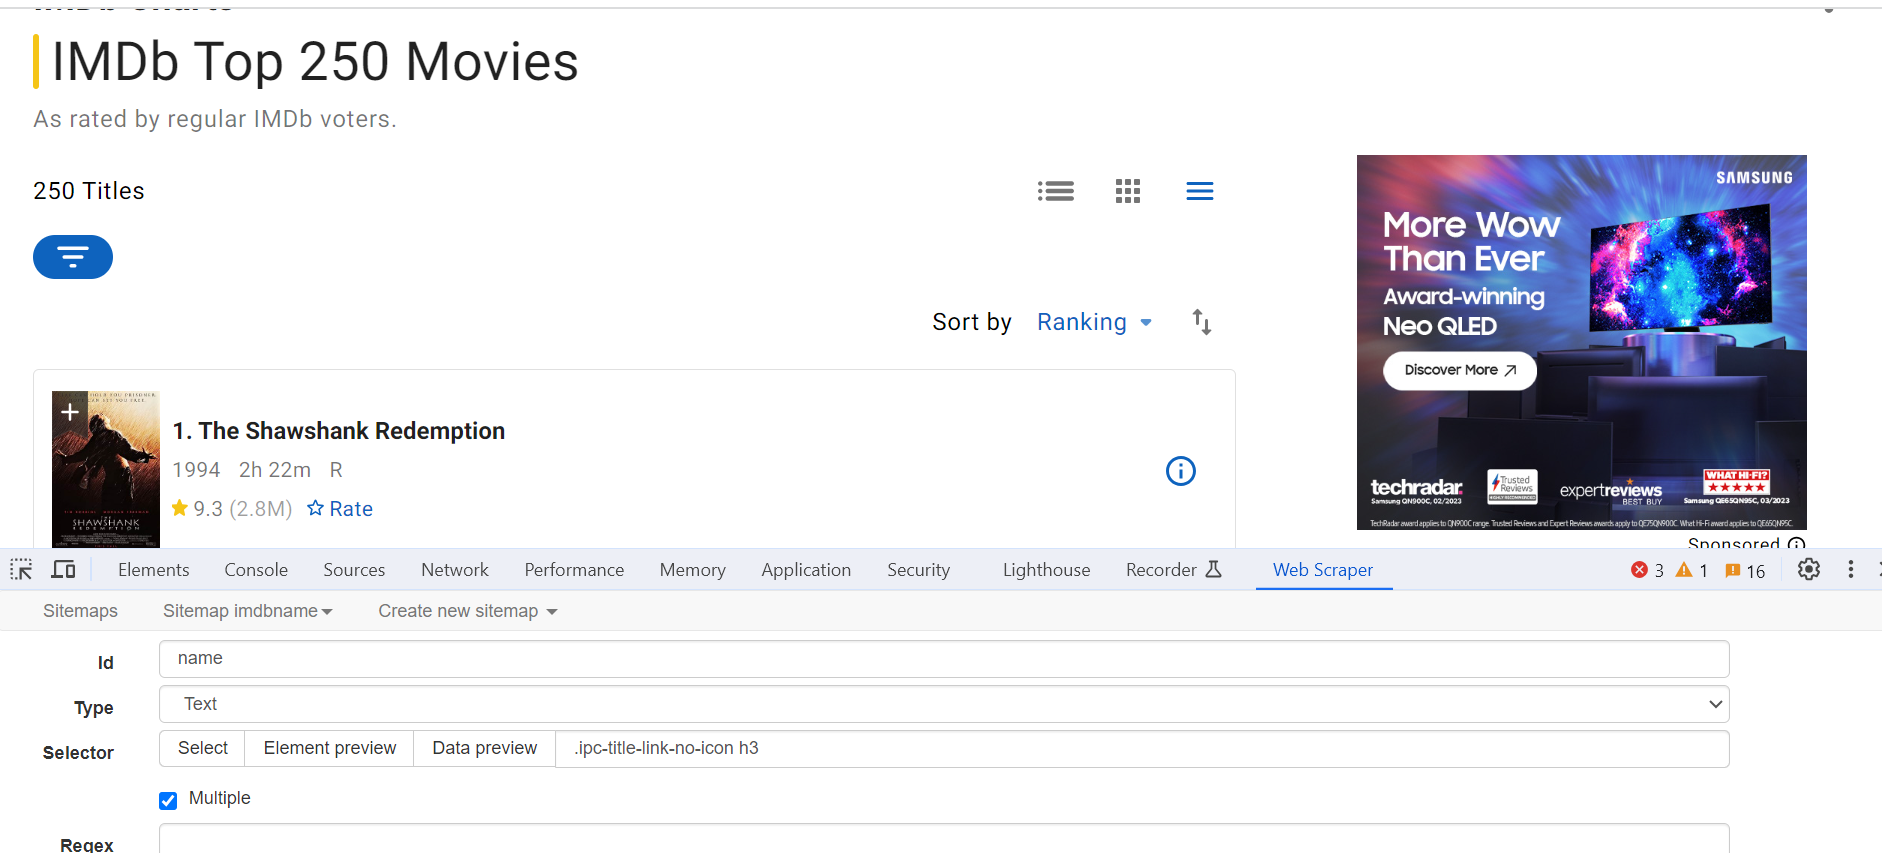
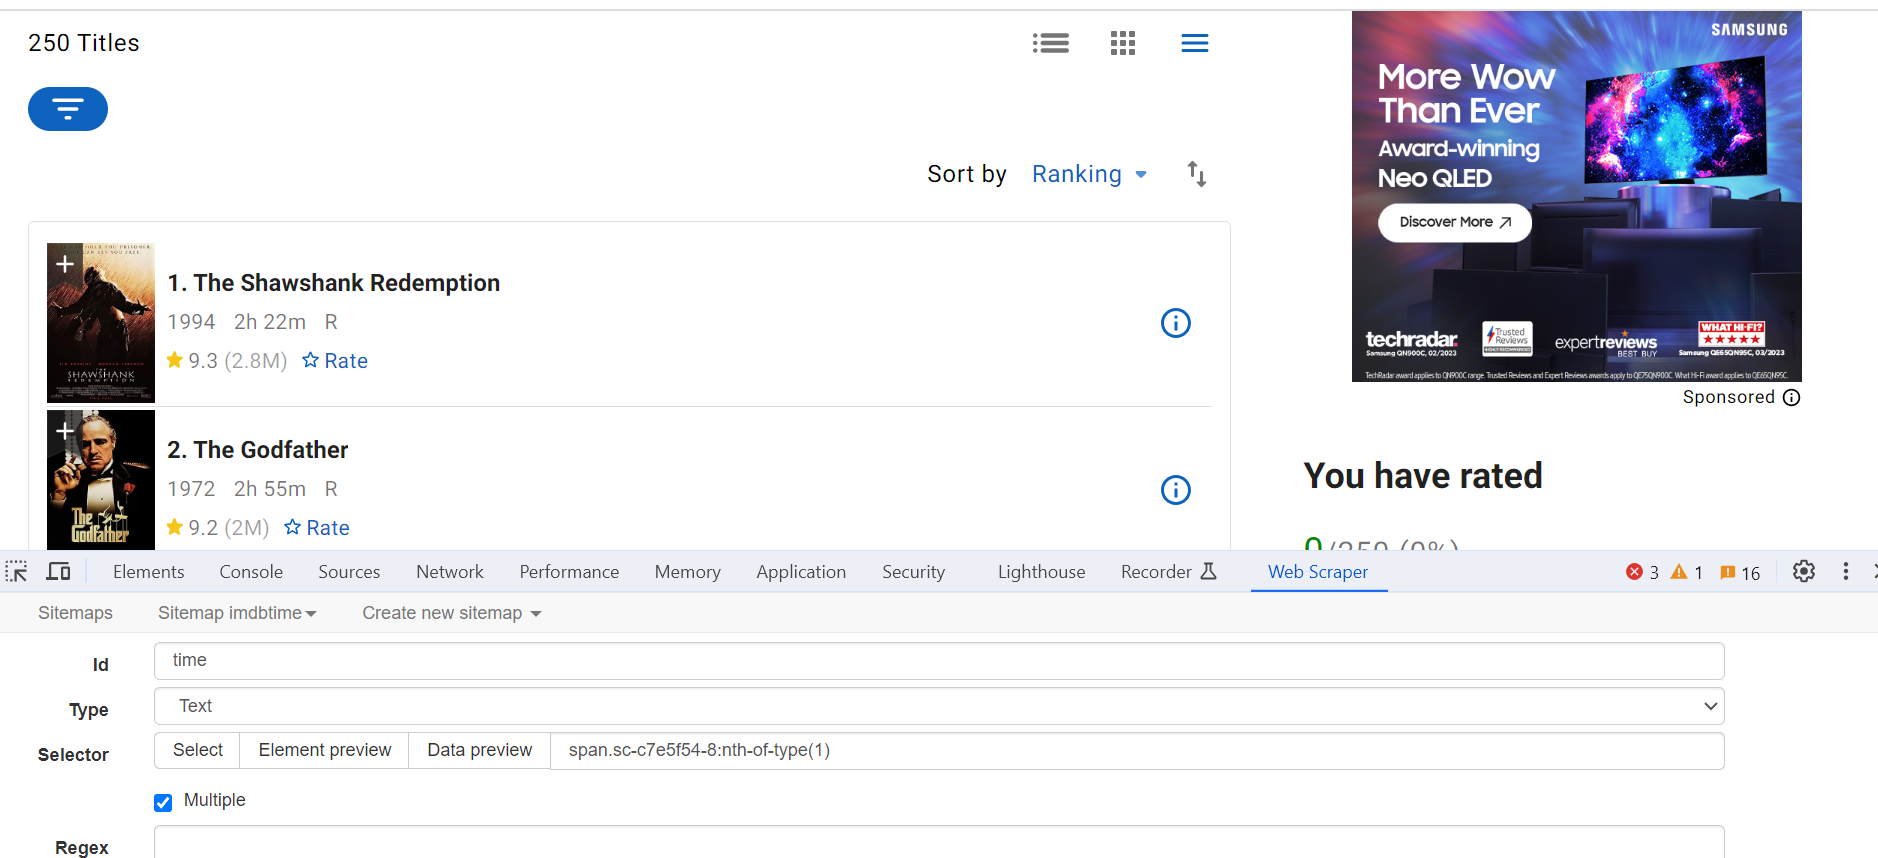
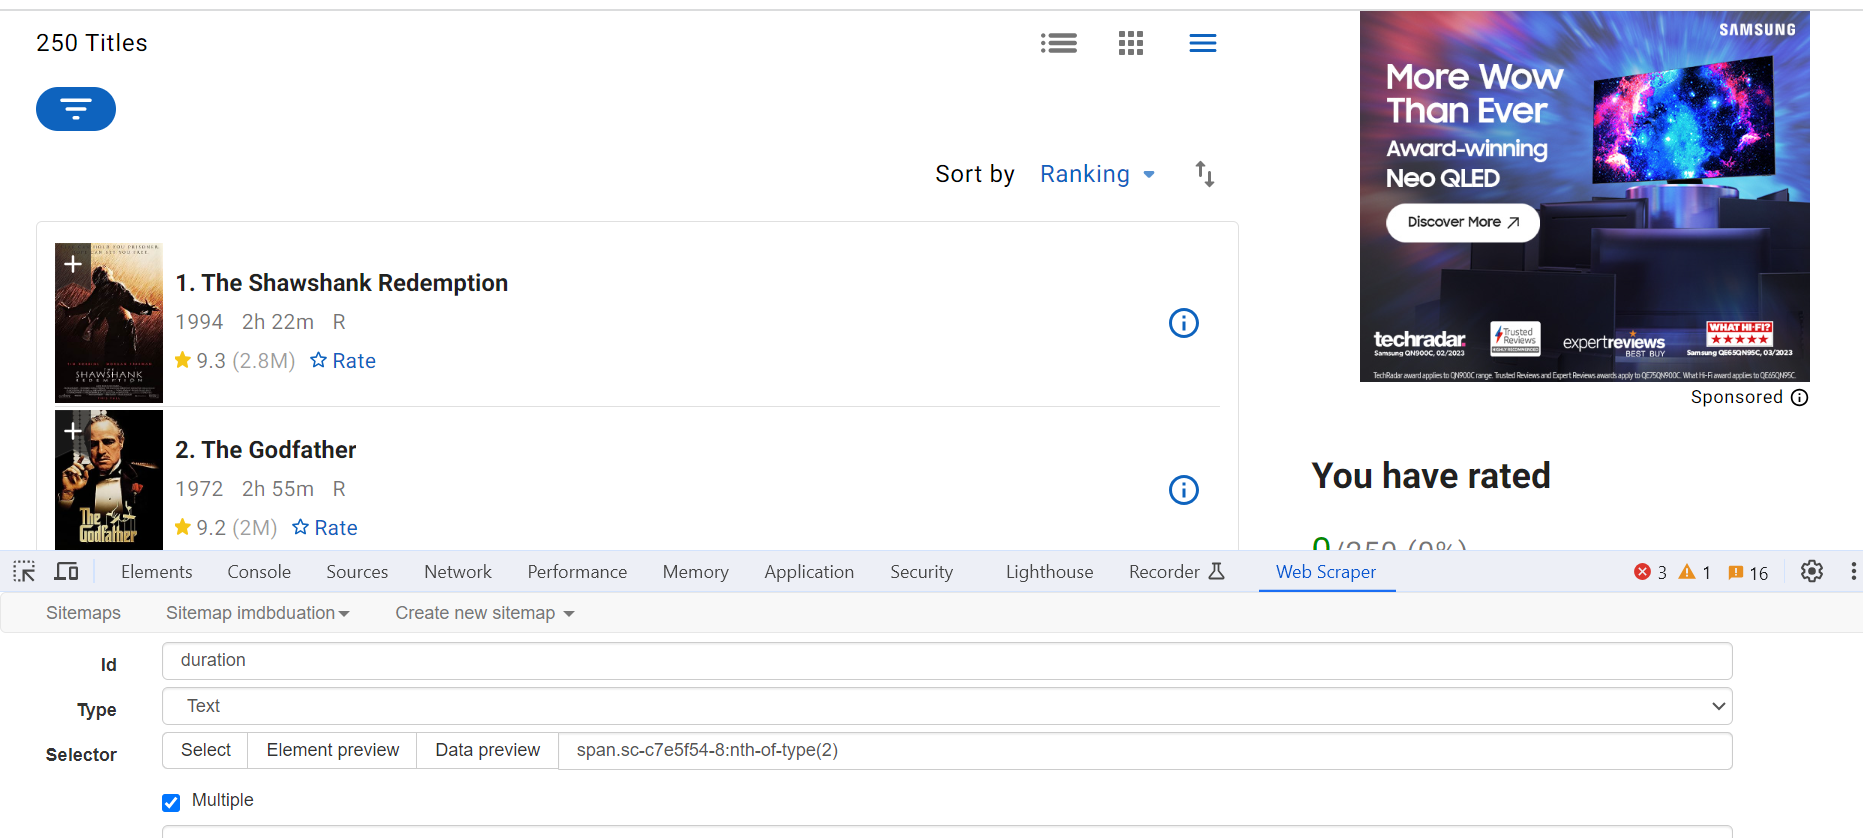
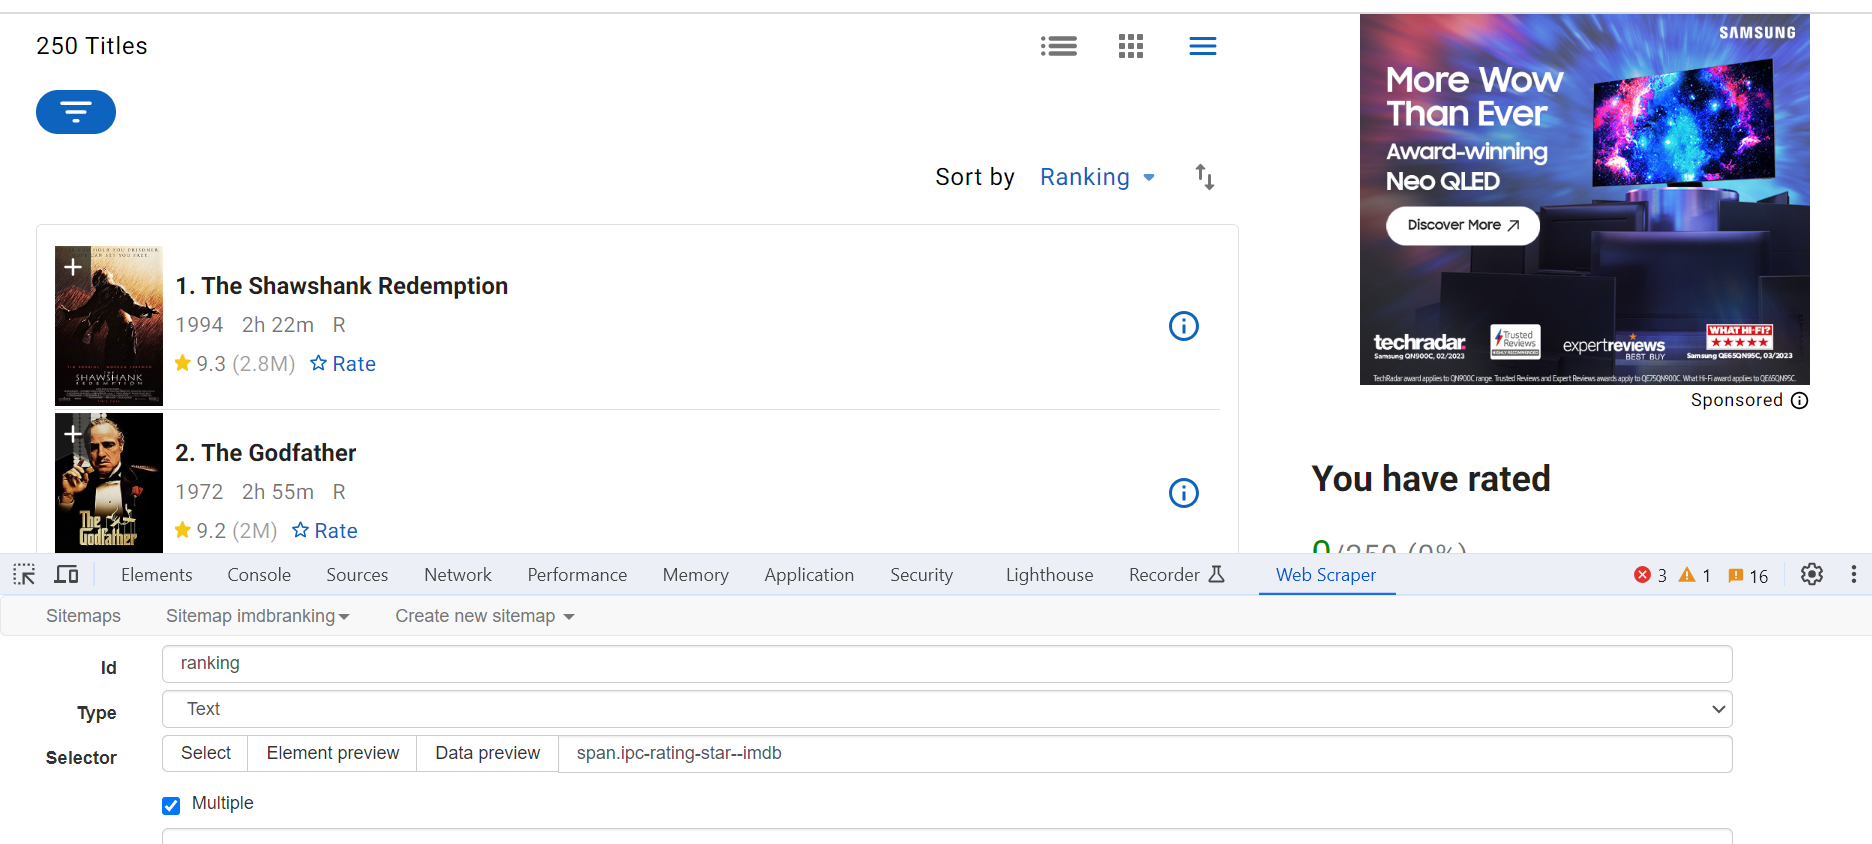
Today, I want to use the web scraper to grab 'IMDb Top 250 Movies'.
First, I search the website about movies that IMDb recommend. Here is the link.
Next, I open the plugin about web scraping, named web scraper. I copy the HTML to the plugin and use same easy way to
In this class, we learned about data visualization. In this class, we learned three visualization software using the data uploaded by the teacher about postify.
as shown in the figure:
After that, I tried to use the data I collected by myself according to the teacher's request last week for data visualization analysis. The software I tried was Excel and Tableau Public.
First came data visualization for Excel tables, then for Tableau Public.
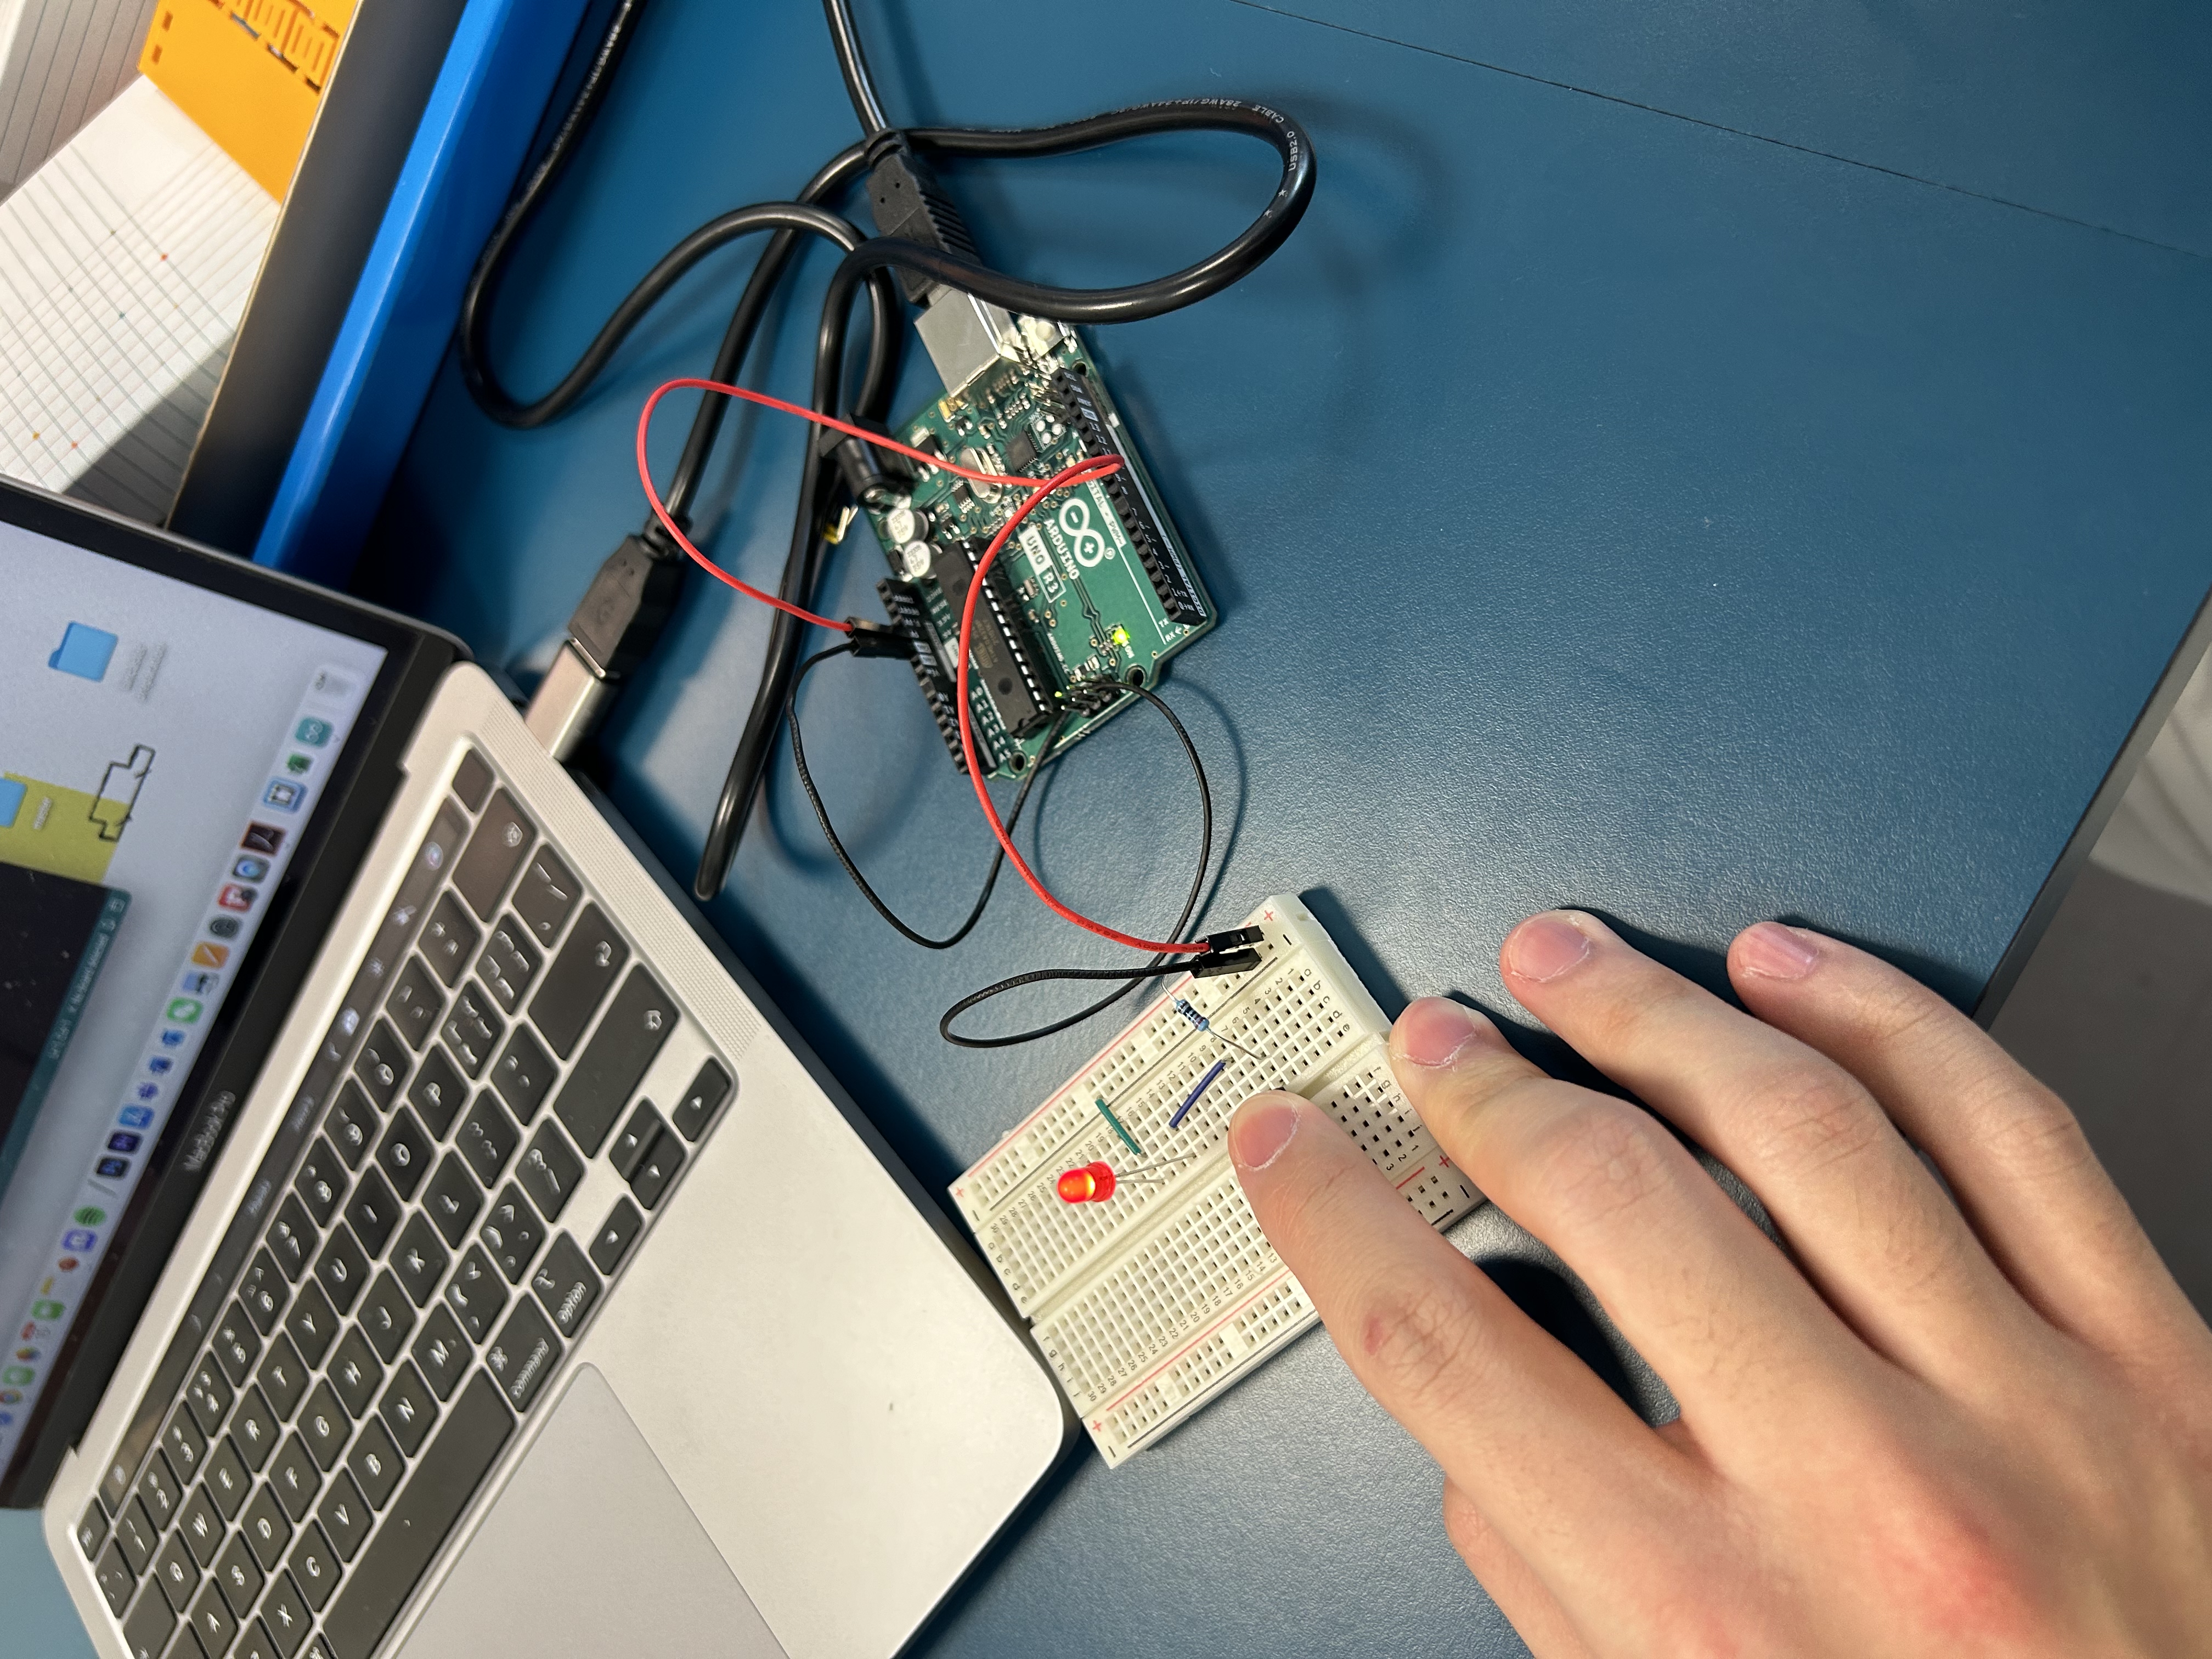
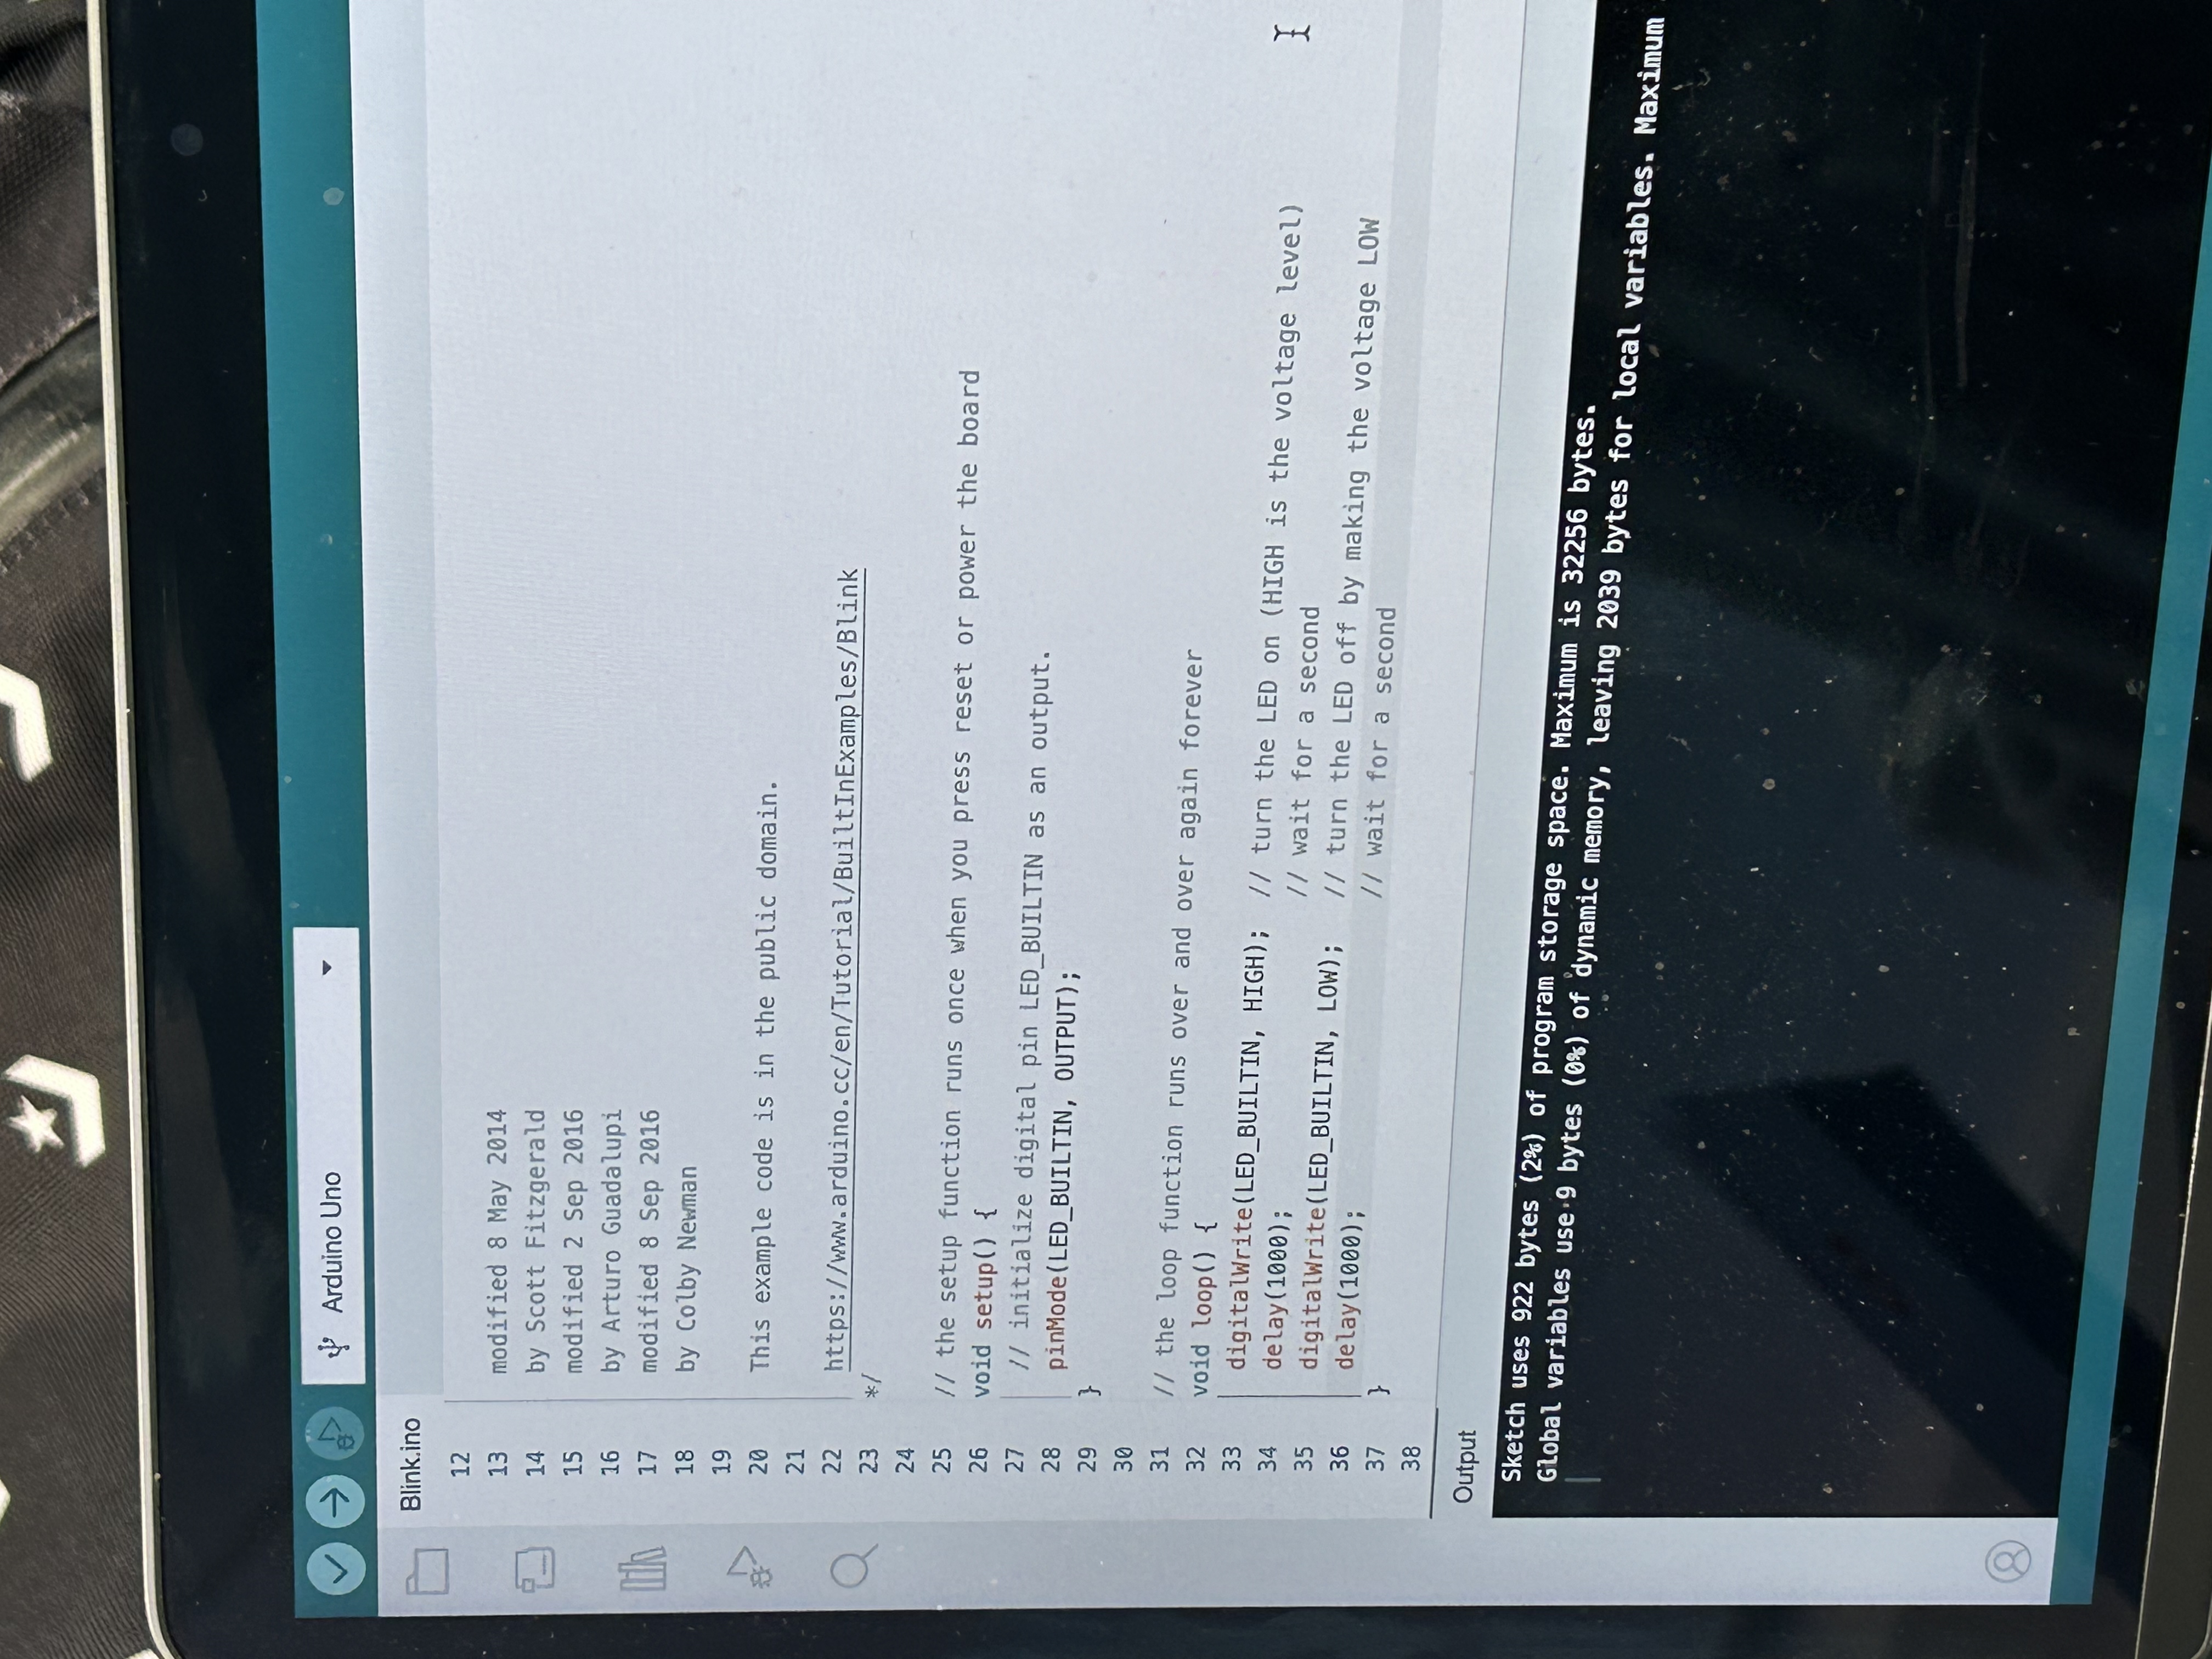
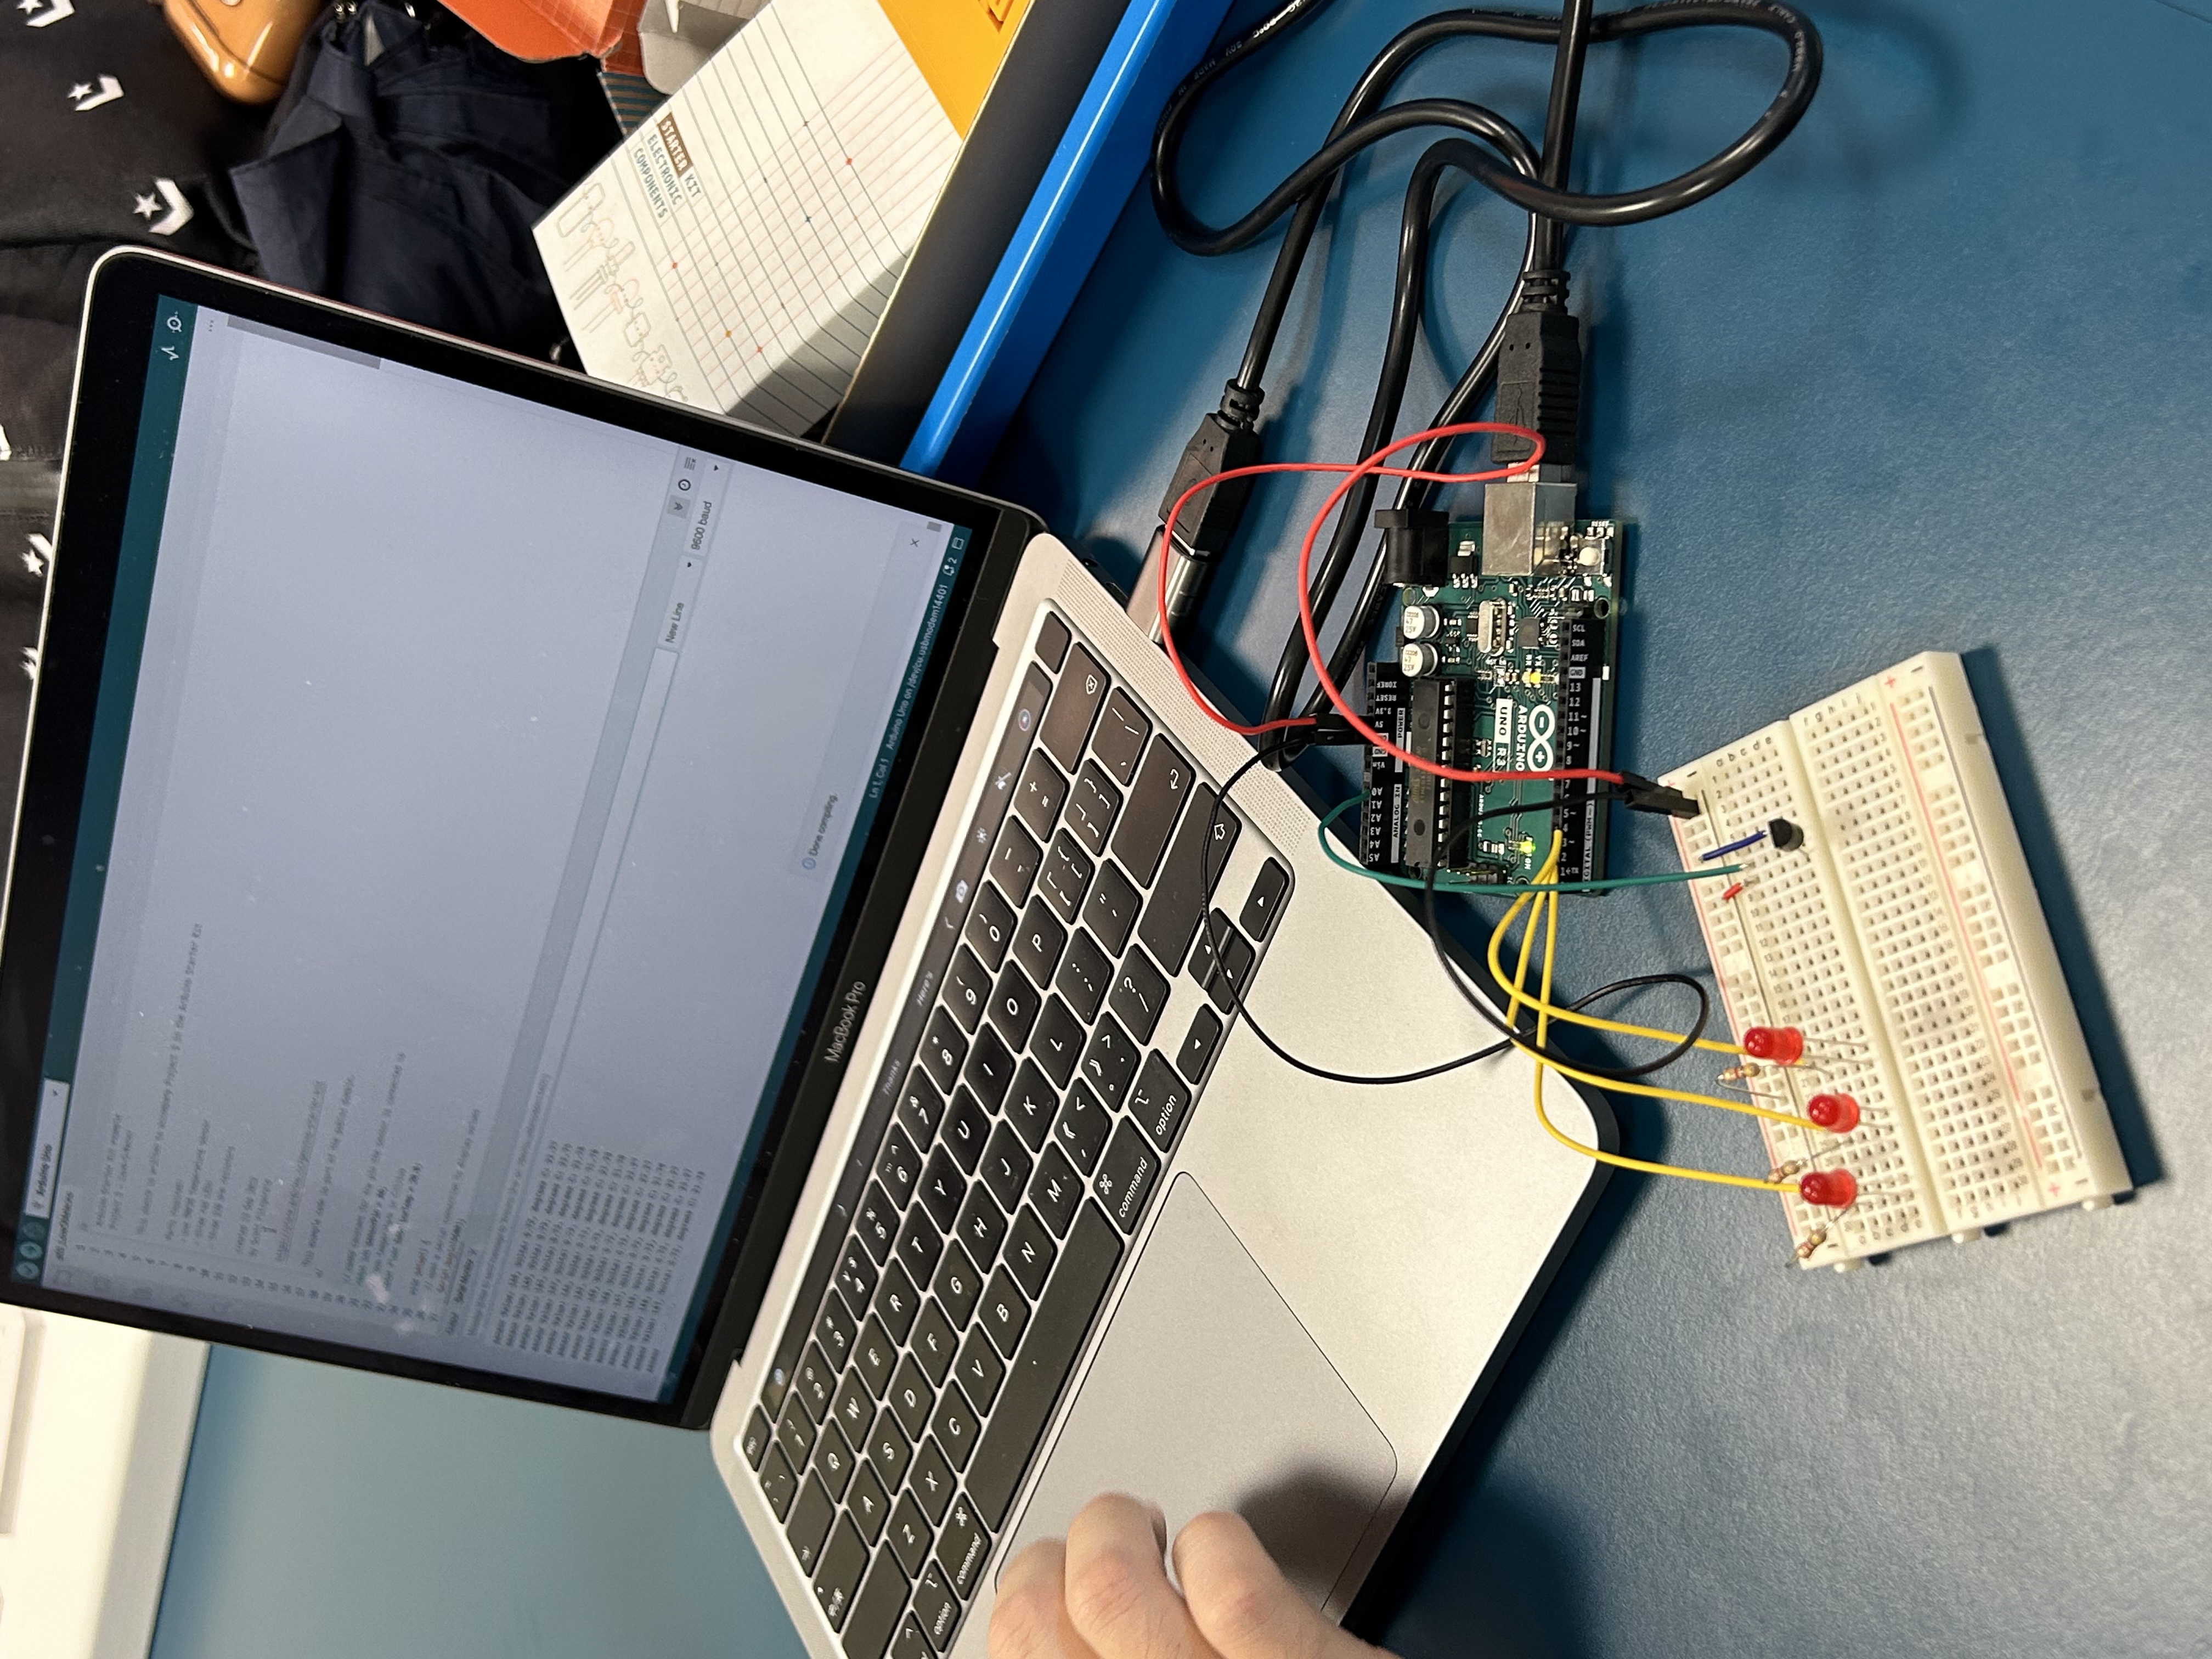
This week was very interesting, we went to helix to learn about kit.
After that, the teacher also encouraged us to develop our own thinking. According to the experiment of Love-o-meter, we discussed a device that can measure the temperature.
I think of greenhouse planting, in fact, in addition to the application of people, we can also use in the direction of agriculture, we can in greenhouse planting and experiments, through this device to pay attention to the temperature in the shed, to give the most intuitive care of plants.